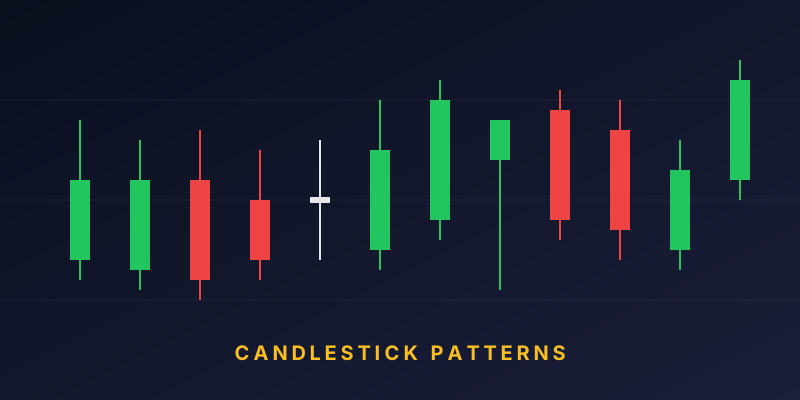
The Head and Shoulders is one of the most widely recognised reversal patterns in technical analysis. When it forms after a sustained uptrend, it often signals that the trend is losing momentum and may soon reverse to the downside. The pattern also has a mirror-image counterpart — the Inverse Head and Shoulders — that signals a potential bullish reversal from a downtrend.
Anatomy of the Pattern
A classic Head and Shoulders consists of three peaks and a baseline called the neckline:
- Left Shoulder: Price rises to a peak and then declines back to a support level.
- Head: Price rises again, this time to a higher peak, and then declines back to roughly the same support level.
- Right Shoulder: Price rises a third time, but fails to reach the height of the head, and then declines once more.
- Neckline: The horizontal (or slightly sloping) line connecting the lows that formed between the shoulders and the head.
The pattern is considered complete and valid only when the price breaks below the neckline on strong volume after forming the right shoulder.
Why This Pattern Works
Head and Shoulders reflects a shift in the balance of power between buyers and sellers:
- During the left shoulder, buyers are strong, but a round of profit-taking causes a pullback.
- At the head, buyers push one more time to a new high — but with less conviction than before.
- At the right shoulder, buyers try again but cannot even reach the previous high. This failure signals weakening demand.
- Sellers take control, pushing price down through the neckline.
In simple terms, the pattern tells us "buyers tried three times to push higher — and the third attempt was the weakest."
How to Measure the Target
Once the neckline is broken decisively, traders often estimate a downside target as follows:
Target = Neckline price − (Head price − Neckline price)
For example, if the head formed at ₹1,000 and the neckline is at ₹900, the "measured move" projects a target around ₹900 − (₹1,000 − ₹900) = ₹800. This is only a projection, not a guarantee — actual market behaviour often differs.
Role of Volume
Volume is critical in validating a Head and Shoulders pattern:
- Volume is usually highest during the left shoulder and the head.
- Volume is often lower during the formation of the right shoulder — a sign that buyers are losing enthusiasm.
- On the neckline break, volume should spike. A weak-volume break is more prone to failure.
Inverse Head and Shoulders
The Inverse Head and Shoulders is the same pattern flipped upside down. It forms at the end of a downtrend and consists of three troughs: a left shoulder, a deeper head, and a shallower right shoulder. The neckline connects the two highs between them.
When price breaks above the neckline on strong volume, it signals a potential bullish reversal. The target is measured by the same method, applied upward.
Timeframes
The pattern can appear on any timeframe — from a 15-minute intraday chart to a weekly chart. Generally, patterns on higher timeframes (daily, weekly) tend to be more reliable and often lead to larger moves. Intraday patterns are more susceptible to noise and false breakouts.
Common Variations
- Sloping Neckline: The neckline doesn’t have to be perfectly horizontal. A mildly upward or downward slope still counts, but a sharply sloping neckline is less reliable.
- Complex Head and Shoulders: Sometimes there are multiple shoulders on either side. The underlying logic (failing to make new highs) is the same.
Avoiding False Breakouts
Not every Head and Shoulders completes. Experienced traders typically wait for:
- A clear close below the neckline (not just an intra-day wick).
- Strong volume on the break.
- A possible retest of the broken neckline from below, which often provides a lower-risk entry.
Placing a stop-loss above the right shoulder is a common risk-management technique. If the price moves back above the right shoulder, the pattern is usually considered invalid.
What a Failed Pattern Looks Like
A Head and Shoulders can fail if, after breaking the neckline, price quickly recovers above it. These failed patterns can lead to sharp moves in the opposite direction, which is why strict stop-loss discipline matters. A broken pattern is as useful a signal as a confirmed one — it tells you the balance of power has shifted.
Key Takeaways
- Head and Shoulders is a reversal pattern with three peaks: left shoulder, head, right shoulder.
- The pattern is confirmed only when price breaks the neckline on strong volume.
- The measured target is roughly the distance from the head to the neckline, projected below the neckline.
- Volume should ideally decline on the right shoulder and spike on the neckline break.
- Patterns on higher timeframes tend to be more reliable than intraday ones.
- Always use a stop-loss — patterns fail, and risk management matters more than any single signal.
This article is for educational purposes only. Technical analysis is probabilistic, and past patterns do not guarantee future results. Please consult a SEBI-registered adviser before making trading decisions.
Trusted References
For verified and up-to-date information on the topics covered above, we recommend consulting the following official regulatory sources in India:
- SEBI — Securities & Exchange Board of India (markets regulator)
- RBI — Reserve Bank of India (banking & monetary policy)
- AMFI — Association of Mutual Funds in India
- NSE India — National Stock Exchange (live data & filings)
- Income Tax Department — for tax rules on investments