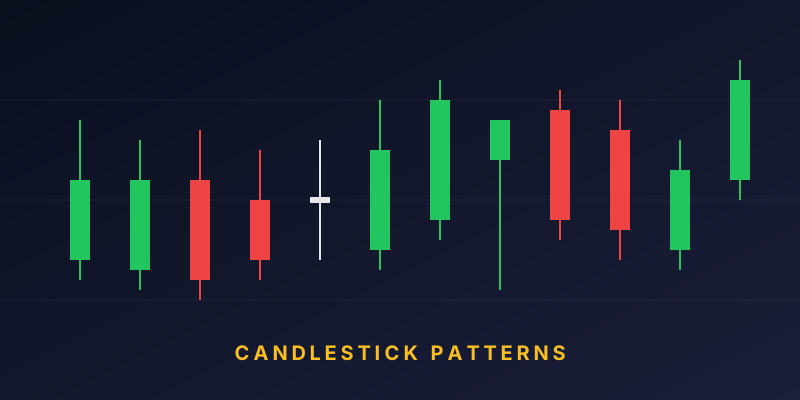
Every candlestick on a chart tells a story of price. The volume below it tells you how many participants agreed with that story. Volume is one of the most powerful — and most ignored — tools in technical analysis. This guide explains what volume reveals and how to use it in your trading.
What Is Volume?
Volume is the total number of shares (or contracts) traded during a given period. On a daily chart, one volume bar represents all shares traded in that day.
High volume means many participants were active. Low volume means few were interested.
Why Volume Matters
1. Confirms Price Moves
A strong up-move on rising volume signals genuine buying interest. The same up-move on low volume is suspect — few buyers, likely to reverse.
2. Reveals Institutional Activity
Big money leaves footprints. Sudden volume surges often indicate institutional accumulation or distribution.
3. Distinguishes Real Breakouts
Breakouts on high volume tend to sustain. Low-volume breakouts often fail (called fake-outs).
4. Warns of Trend Weakness
An uptrend on declining volume suggests fatigue. Prices may continue up briefly but a reversal often follows.
Common Volume Patterns
1. Volume Spikes on Reversals
At a market bottom, you often see a huge volume spike (capitulation selling). At market tops, you may see a euphoric volume spike (final buying frenzy).
2. Volume Confirming Trends
Healthy uptrend: rising volume on up days, lower volume on down days. Healthy downtrend: rising volume on down days.
3. Volume on Breakouts
Genuine breakout: price breaks resistance with volume 1.5-2x average. Fake breakout: price barely clears resistance on light volume.
4. Volume Divergence
Price makes new highs but volume declines — a warning sign that the trend is weakening.
Volume Indicators
1. Volume MA (Moving Average)
Plot a 20-day moving average of volume. Bars above the MA indicate above-average interest; below indicate light activity.
2. OBV (On-Balance Volume)
Adds volume on up days, subtracts on down days. A running total that shows accumulation vs distribution over time.
3. VWAP (Volume Weighted Average Price)
Popular with intraday traders. Institutional buyers try to trade around VWAP. Prices above VWAP suggest strength; below suggest weakness.
4. Volume Profile
Shows how much volume occurred at each price level. Reveals "high volume nodes" (HVN) — price levels of significant activity, often future support/resistance.
Reading Volume in Context
Bullish Signals
- Price rising on above-average volume.
- Breakout above resistance on strong volume.
- Small pullbacks on low volume during uptrends.
- Capitulation volume at potential bottoms followed by upward reversal.
Bearish Signals
- Price falling on above-average volume.
- Breakdown below support on strong volume.
- Rallies on declining volume during downtrends.
- Distribution volume near price tops.
Volume + Candlesticks
Powerful combinations:
- Bullish Engulfing candle with 2x average volume = high-quality bullish signal.
- Doji at resistance with high volume = potential reversal top.
- Hammer at support with rising volume = bullish reversal candidate.
- Shooting Star with heavy volume = potential top signal.
Practical Volume Rules
- Never trust a breakout without volume confirmation.
- Reversal candles matter more with above-average volume.
- Trends on declining volume are living on borrowed time.
- Individual stocks need volume analysis more than indices (indices are always liquid).
- Compare current volume to the stock's own historical average, not to other stocks.
Common Mistakes
- Focusing only on price and ignoring volume.
- Assuming high volume means "up" — it just means activity.
- Chasing breakouts on very low volume.
- Overreacting to single-day volume spikes (context matters).
- Ignoring volume in low-cap or illiquid stocks (where it matters most).
Volume in Different Markets
- Large-cap stocks — volume is meaningful; institutions are active.
- Small-cap stocks — volume can be manipulated by single traders. Interpret carefully.
- ETFs — on-screen volume may understate real liquidity due to underlying market depth.
- Futures / options — open interest is often more meaningful than raw volume.
Final Thoughts
Volume is the missing piece of chart reading. Learning to interpret it alongside price transforms how you see markets. It won't make you infallible, but it will help you avoid fake breakouts, confirm strong trends, and spot exhaustion. Every serious trader should look at volume — not just price — before making a decision.