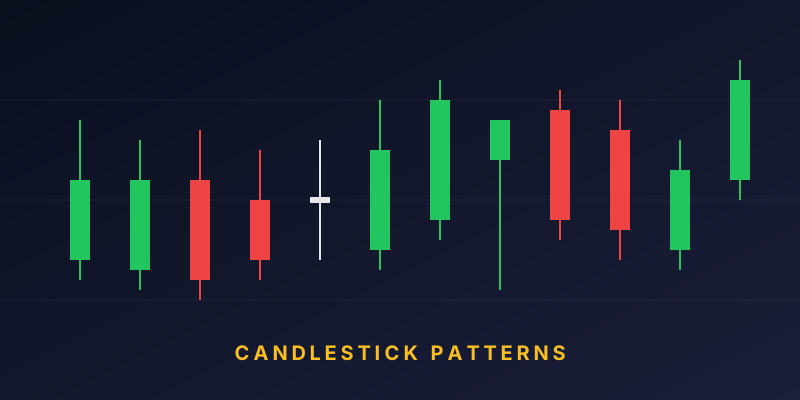
Candlestick patterns are visual signals that show up when price action forms recognizable combinations. Traders use them to anticipate what might happen next — a reversal, a continuation, or a pause. Here are the ten most useful candlestick patterns every trader should know, along with what each one typically signals.
1. Doji
A Doji forms when the open and close are almost identical, producing a very small body with wicks on both sides. It signals indecision. When a Doji appears after a strong trend, it often precedes a reversal — but it must be confirmed by the next candle.
2. Hammer
The Hammer has a small body at the top and a long lower wick, at least twice the size of the body. It usually forms at the bottom of a downtrend and hints at a bullish reversal. Buyers stepped in aggressively after sellers tried to push the price lower.
3. Shooting Star
The mirror image of the Hammer. It has a small body at the bottom and a long upper wick, forming at the top of an uptrend. It signals a potential bearish reversal — buyers tried to push higher, but sellers rejected the move.
4. Bullish Engulfing
A two-candle pattern where a small bearish (red) candle is followed by a much larger bullish (green) candle that completely engulfs the previous body. It usually appears at the end of a downtrend and signals a strong bullish reversal.
5. Bearish Engulfing
The opposite of Bullish Engulfing. A small green candle is followed by a larger red candle that engulfs the previous body. Appears at the top of an uptrend and signals a strong bearish reversal.
6. Morning Star
A three-candle bullish reversal pattern. It consists of:
- A long bearish candle.
- A small-bodied candle (the "star") — either bullish, bearish, or Doji.
- A long bullish candle that closes deep into the first candle's body.
Together, these show that the downtrend has lost momentum and buyers are taking control.
7. Evening Star
The bearish opposite of the Morning Star. Three candles: a long bullish candle, a small star, and a long bearish candle. It appears at the top of an uptrend and signals a reversal to the downside.
8. Piercing Line
A two-candle bullish reversal pattern that appears after a downtrend. The first candle is a long bearish one; the second opens below the previous low but closes more than halfway up the first candle's body. It shows sudden buyer interest.
9. Dark Cloud Cover
The bearish counterpart of Piercing Line. After an uptrend, a long bullish candle is followed by a bearish candle that opens above the previous high but closes below the midpoint of the previous body — a warning that sellers are gaining ground.
10. Three White Soldiers / Three Black Crows
Three White Soldiers is three consecutive strong bullish candles, each closing higher than the previous. It signals a strong bullish continuation or reversal from a downtrend.
Three Black Crows is the opposite — three consecutive strong bearish candles closing lower each time. It signals a firm bearish move.
How to Use Candlestick Patterns Effectively
- Wait for confirmation. Never trade on a single pattern in isolation. Look for follow-through in the next candle or two.
- Consider the location. Patterns near support/resistance levels or trendlines are more reliable than random ones.
- Check the timeframe. Daily and weekly patterns are generally more meaningful than 5-minute ones.
- Use volume as a filter. Reversal patterns supported by higher-than-average volume tend to be stronger.
- Combine with other tools. Moving averages, RSI, and trendlines can help confirm signals.
Common Mistakes to Avoid
- Assuming every pattern will play out — even good patterns fail regularly.
- Trading against the overall trend based on a single reversal signal.
- Ignoring the broader context: news, earnings, or key economic events.
- Over-relying on patterns and neglecting risk management.
Final Thoughts
Candlestick patterns give traders a language to describe what buyers and sellers are doing. But they are probabilities, not certainties. The best traders combine patterns with trend analysis, support/resistance, volume, and strict risk management. Master these ten patterns, and you will read charts with far more confidence.