Among all the candlestick patterns traders learn, the Doji is probably the most misunderstood. On its own it does not predict a move; it signals indecision. But in the right context, a Doji can mark the exact moment where a trend quietly runs out of steam. This guide explains the four main Doji types and how to read them.
What Is a Doji?
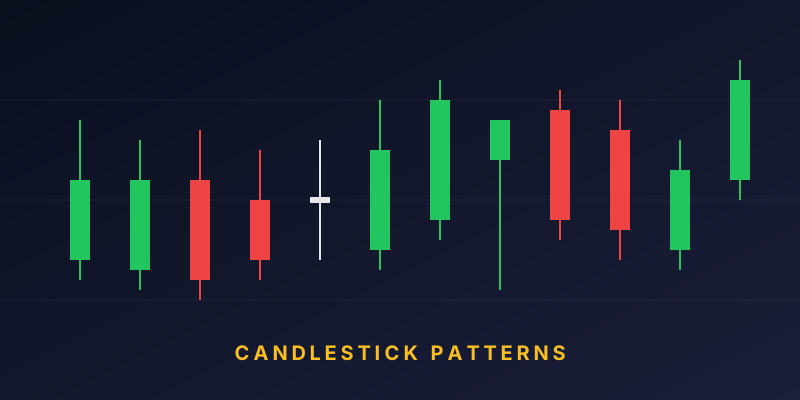
A Doji is a candle where the open and close prices are almost identical. The body is extremely small (sometimes just a line), while the upper and lower wicks can be of varying sizes. Visually, it looks like a plus sign or a cross.
Because buyers and sellers finished the session at roughly the same price — despite often fighting it out through the wicks — a Doji represents a balance of forces. The direction of the next move depends on which side wins over the following candles.
The Four Main Doji Patterns
1. Standard Doji
The classic version: a small cross with roughly equal upper and lower wicks. Price moved both up and down during the session but closed near the open.
What it signals: Simple indecision. Needs confirmation from the next candle.
2. Long-Legged Doji
A Doji with very long upper and lower wicks. This means price travelled a wide range during the session but still ended near the open.
What it signals: Strong indecision and high volatility. Often appears near key support or resistance levels, or during news events. The longer the wicks, the stronger the message that neither side could take control.
3. Gravestone Doji
A Doji where the open and close are at the bottom of the candle, with a long upper wick and little or no lower wick.
What it signals: Price was pushed up strongly during the session but was fully rejected and returned to the open. In an uptrend, this is a potential bearish reversal signal, especially if the next candle closes lower.
4. Dragonfly Doji
The mirror image of the Gravestone. Open and close are at the top of the candle, with a long lower wick and little or no upper wick.
What it signals: Price was sold down during the session but buyers stepped in and pushed it all the way back up by the close. In a downtrend, this is a potential bullish reversal signal, especially when followed by a strong green candle.
Context Is Everything
A Doji is almost meaningless in isolation. What matters is where it appears:
- A Doji at the top of a strong uptrend — worth watching for exhaustion.
- A Doji after a sharp decline near a known support zone — watch for a possible reversal.
- A Doji in the middle of a sideways range — usually just noise.
Experienced traders combine Doji signals with price action — trend direction, support/resistance levels, and prior candle structure — before acting.
Confirming a Doji Signal
A good practice is to wait for the next candle before making a decision. For example, a Gravestone Doji at the top of a rally is more reliable when the next candle:
- Closes below the Doji’s open/close level.
- Is a wide-bodied red candle on higher volume.
Similarly, a Dragonfly Doji at a support zone gains conviction if the next candle is a strong green close.
Volume Matters
Doji candles that appear on above-average volume deserve more attention than Doji candles on light volume. Heavy volume with no net price change means a lot of participants fought and neither side won — often a precursor to a sharper move. Light-volume Doji candles are frequently just quiet pauses.
Common Mistakes When Trading Doji Patterns
- Treating every Doji as a reversal signal. Most are just noise.
- Entering a trade on the Doji itself without confirmation.
- Ignoring the broader trend. A Dragonfly Doji inside a strong downtrend may just be a pause, not a reversal.
- Reading Doji candles on very low timeframes (like one-minute charts), where they appear constantly.
Practical Example (Hypothetical)
Imagine a Nifty 50 stock has been rallying for ten sessions. On day eleven, it opens high, pushes further up during the day, but by the close, sellers have pushed it all the way back to the open. The candle looks like a Gravestone Doji on heavy volume. The next day opens weak and closes red. Many trend-based traders would see this as a potential short-term exhaustion signal and tighten their stop-loss, trim position size, or avoid new long entries.
Note: this is only an educational illustration. Markets are probabilistic — patterns fail routinely, and risk management matters more than any single signal.
Key Takeaways
- A Doji candle marks indecision, not a guaranteed reversal.
- Standard, Long-Legged, Gravestone, and Dragonfly are the four main types.
- Location (near support, resistance, or trend ends) is more important than the pattern itself.
- Always wait for confirmation from the next candle and consider volume.
- Combine with risk management; never trade based on a single signal.
This content is for educational purposes only and does not constitute trading advice. Please consult a SEBI-registered adviser before making trading decisions.
Trusted References
For verified and up-to-date information on the topics covered above, we recommend consulting the following official regulatory sources in India:
- SEBI — Securities & Exchange Board of India (markets regulator)
- RBI — Reserve Bank of India (banking & monetary policy)
- AMFI — Association of Mutual Funds in India
- NSE India — National Stock Exchange (live data & filings)
- Income Tax Department — for tax rules on investments